Life Cycle Illustration
The contents of this page illustrate a pavement's life cycle emissions created by the PE-2 estimator tool using data from the observed MDOT projects.
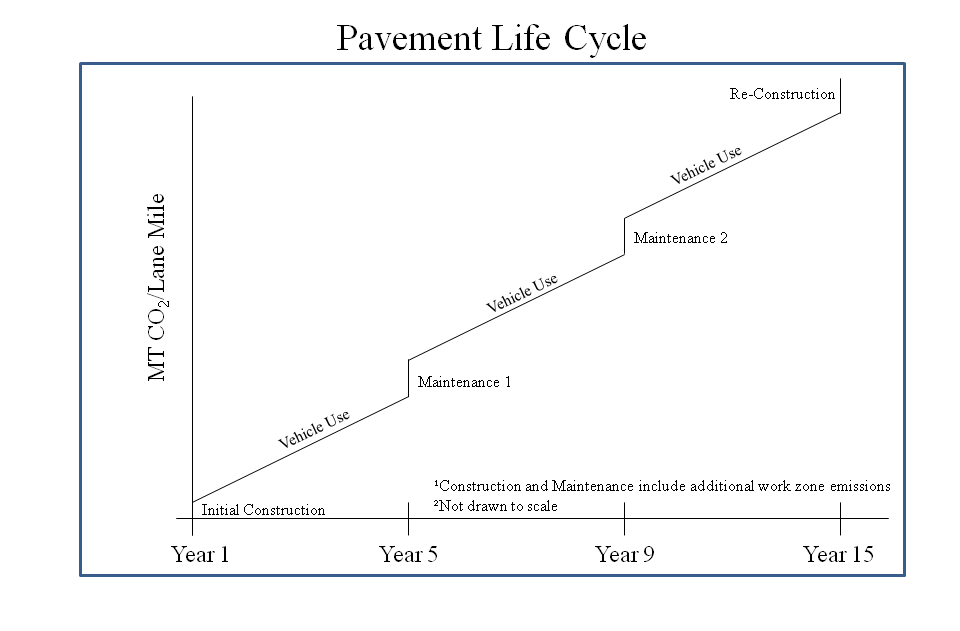
Figure 1: Conceptual Illustration of Pavement Life Cycle outlines the cumulative emissions associated with typical roadway’s life cycle. Emissions outlined by the PE2 Life Cycle Tool include:
- Construction Emissions
- Emissions from the manufacturing and processing of virgin and recycled materials
- Emissions from on-site construction equipment
- Emissions from hauling equipment hauling materials to and from the project site
- Upstream Impacts for the manufacturing of the fuel combusted in the construction and hauling equipment
- Upstream impacts from the manufacturing of equipment being used on site
- Work Zone Emissions
- Emissions associated with traffic delay throughout work zone durations
- Use Phase Emissions
- Emissions associated with vehicle use of the roadway
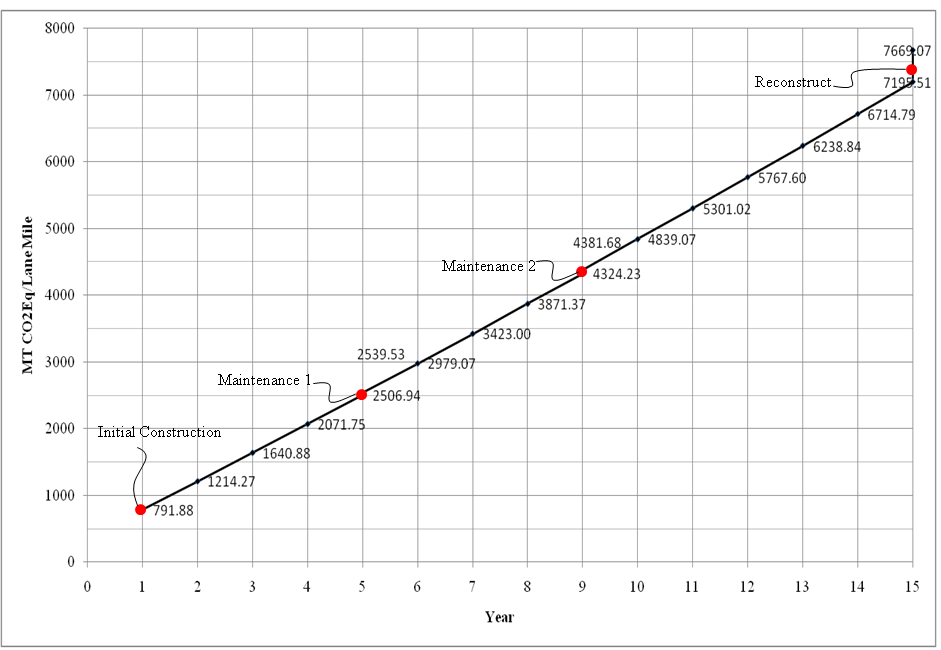
To illustrate the information outlined in Figure 1: Conceptual Illustration of Pavement Life Cycle the following example was modeled using the PE2 Life Cycle Tool and the following results were obtained:
1. General Project Information
- Roadway Speed = 70mph
- Average Daily Traffic = 8800 vehicles/day
- Project Length = 10 miles
- Number of lanes = 4 (Results in 40 lane miles)
- Emissions from US-31 HMA Reconstruct (PN50757) were used to account for year 1 initial construction and work zone emissions.
- The duration of the project was determined to be 197 days
- Emissions from US-31 Over band Crack seal and Micro surface (PN106529) were used to represent the first maintenance.
- Defined at year 5
- Emissions from M-20 HMA Cold milling and Overlay (PN105611) were used to represent the second maintenance.
- Defined at year 9
- Emissions from US-41 HMA Reconstruct and Realignment (PN80145) were used to represent the end-of-life.
- Defined at year 15
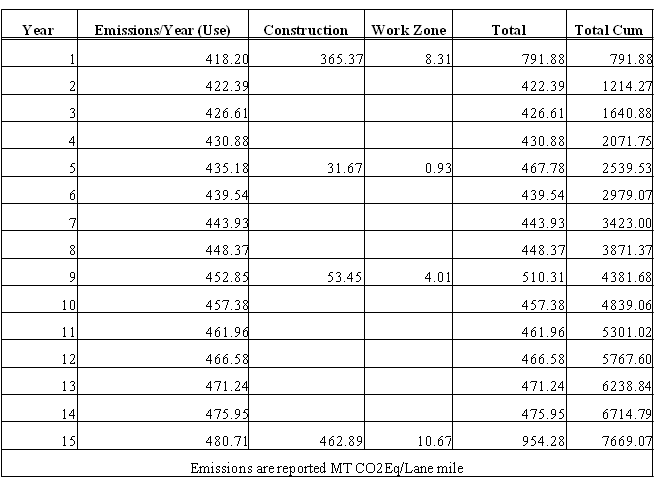
Results from the life cycle illustration are outlined in Table 1: Life Cycle Emissions and Figure 2: Life Cycle Emissions. Emissions associated with construction, maintenance and work zones are diminutive compared to emissions associated with vehicle use. Emissions from the use phase can represent 85-95% of the pavement life cycle.